We are going to install node_exporter and configure Prometheus to monitor Linux servers.
The node_exporter service is a Prometheus exporter for hardware and OS metrics exposed by Linux kernels.
Pre-requisites
We are using our Kubernetes homelab in this article.
Install and Configure Node Exporter
Ansible Playbook to Configure Node Exporter
I use Ansible to manage my homelab, including Linux servers and node_exporter.
Below is an excerpt from the file main.yml of the Ansible role that manages node_exporter.
- name: Ensure group {{ prometheus_user }} exists
  group:
    state: present
    system: yes
    name: "{{ prometheus_user }}"

- name: Create user {{ prometheus_user }}
  user:
    state: present
    system: yes
    name: "{{ prometheus_user }}"
    groups: "{{ prometheus_user }}"
    shell: "/sbin/nologin"

- name: Open node exporter firewall port tcp {{ node_exporter_port }}
  firewalld:
    immediate: yes
    permanent: yes
    state: enabled
    port: "{{ node_exporter_port }}/tcp"

- name: Unarchive a file that needs to be downloaded
  unarchive:
    src: "{{ node_exporter_url }}"
    dest: "/usr/local/bin"
    remote_src: yes
    owner: root
    group: root
    creates: "/usr/local/bin/{{ node_exporter_binary }}"
    extra_opts:
      - "--strip-components"
      - "1"

- name: Copy {{ node_exporter_systemd_service }}
  template:
    src: "{{ node_exporter_systemd_service }}.j2"
    dest: "/etc/systemd/system/{{ node_exporter_systemd_service }}"
    owner: root
    group: root
    mode: "0644"

- name: systemctl daemon-reload
  command: systemctl daemon-reload

- name: Start and enable service {{ node_exporter_systemd_service }}
  service:
    name: "{{ node_exporter_systemd_service }}"
    state: started
    enabled: yes
We are going to break it down in to tasks.
Create a User/Group
We are going to create a user/group called “prometheus” to run the systemd service as.
Run the following commands on Linux servers where you want node exporter configured:
$ sudo groupadd prometheus
$ sudo useradd --system -s /sbin/nologin -g prometheus prometheus
Configure Firewall
Configure firewall to allow inbound access on a TCP port 9100.
Run the following commands on Linux servers where you want node exporter configured:
$ sudo firewall-cmd --permanent --add-port=9100/tcp
$ sudo firewall-cmd --reload
Install node_exporter
Run the following commands on Linux servers where you want node exporter configured:
$ wget -q https://github.com/prometheus/node_exporter/releases/download/v1.0.1/node_exporter-1.0.1.linux-amd64.tar.gz
$ sudo tar --strip-components=1 -xf node_exporter-1.0.1.linux-amd64.tar.gz -C /usr/local/bin/
$ sudo chown -R root: /usr/local/bin/
Create node_exporter Systemd Service
Create a file /etc/systemd/system/node_exporter.service on Linux servers with the following content:
[Unit]
Description=Prometheus
Documentation=https://github.com/prometheus/node_exporter
Wants=network-online.target
After=network-online.target

[Service]
Type=simple
User=prometheus
Group=prometheus
ExecReload=/bin/kill -HUP $MAINPID
ExecStart=/usr/local/bin/node_exporter \
    --collector.cpu \
    --collector.diskstats \
    --collector.filesystem \
    --collector.loadavg \
    --collector.meminfo \
    --collector.filefd \
    --collector.netdev \
    --collector.stat \
    --collector.netstat \
    --collector.systemd \
    --collector.uname \
    --collector.vmstat \
    --collector.time \
    --collector.tcpstat \
    --collector.hwmon \
    --collector.arp \
    --web.max-requests=40 \
    --web.listen-address=0.0.0.0:9100 \
    --web.telemetry-path=/metrics

SyslogIdentifier=prometheus
Restart=always

[Install]
WantedBy=multi-user.target
Set appropriate permissions:
$ sudo chown -R root: /etc/systemd/system/node_exporter.service
$ sudo chmod 0644 /etc/systemd/system/node_exporter.service
Enable and start the service:
$ sudo systemctl daemon-reload
$ sudo systemctl enable --now node_exporter
Configure Prometheus Scraping
Add static configs that match your Linux servers to the Prometheus config map and restart the pod:
      - job_name: 'admin1'
        static_configs:
          - targets: ['10.11.1.2:9100']
            labels:
              alias: admin1
      - job_name: 'admin2'
        static_configs:
          - targets: ['10.11.1.3:9100']
            labels:
              alias: admin2
      - job_name: 'kvm1'
        static_configs:
          - targets: ['10.11.1.21:9100']
            labels:
              alias: kvm1
      - job_name: 'kvm2'
        static_configs:
          - targets: ['10.11.1.22:9100']
            labels:
              alias: kvm2
      - job_name: 'kvm3'
        static_configs:
          - targets: ['10.11.1.23:9100']
            labels:
              alias: kvm3
      - job_name: 'k8s-master1'
        static_configs:
          - targets: ['10.11.1.31:9100']
            labels:
              alias: k8s-master1
      - job_name: 'k8s-master2'
        static_configs:
          - targets: ['10.11.1.32:9100']
            labels:
              alias: k8s-master2
      - job_name: 'k8s-master3'
        static_configs:
          - targets: ['10.11.1.33:9100']
            labels:
              alias: k8s-master3
      - job_name: 'k8s-node1'
        static_configs:
          - targets: ['10.11.1.34:9100']
            labels:
              alias: k8s-node1
      - job_name: 'k8s-node2'
        static_configs:
          - targets: ['10.11.1.35:9100']
            labels:
              alias: k8s-node2
      - job_name: 'k8s-node3'
        static_configs:
          - targets: ['10.11.1.36:9100']
            labels:
              alias: k8s-node3
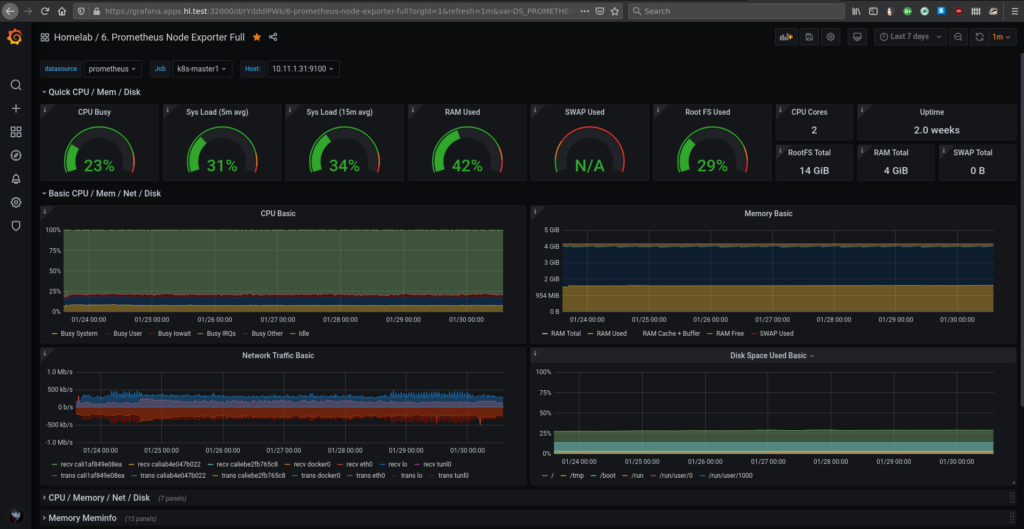
Add Grafana Dashboard for HAProxy
Install the “Node Exporter Full” Grafana dashboard: https://grafana.com/grafana/dashboards/1860
The end result should look something like this:
References
https://github.com/prometheus/node_exporter
Merci beaucoup!
Très utile